Insurance Agency Valuation Calculator
Use an insurance agency valuation calculator to estimate what your agency is worth. 2026 multiples, retention math, deal structure, and what buyers actually pay.
An insurance agency valuation calculator applies a multiple to your revenue or EBITDA to produce a market-value estimate. In 2026, independent P&C agencies sell for roughly 1.5x to 3.5x annual commission revenue, or 6x to 12x adjusted EBITDA, depending on the quality of the book, carrier relationships, and growth rate. The tool gives you a starting number, not a sale price. What happens after you get that number is where the real conversation starts.
TL;DR
- Insurance agency valuation calculators estimate value by applying a multiple to revenue (1.5x to 3.5x) or EBITDA (6x to 12x), per 2026 data from Sica Fletcher and CT Acquisitions.
- The multiple your agency actually commands depends on four factors: book retention above 90%, carrier appointment quality, commission mix (commercial vs. personal lines), and organic growth rate.
- A revenue multiple treats every dollar of commission the same. An EBITDA multiple accounts for profitability. Buyers use EBITDA for agencies above $1M revenue; for smaller shops, revenue multiples are the norm.
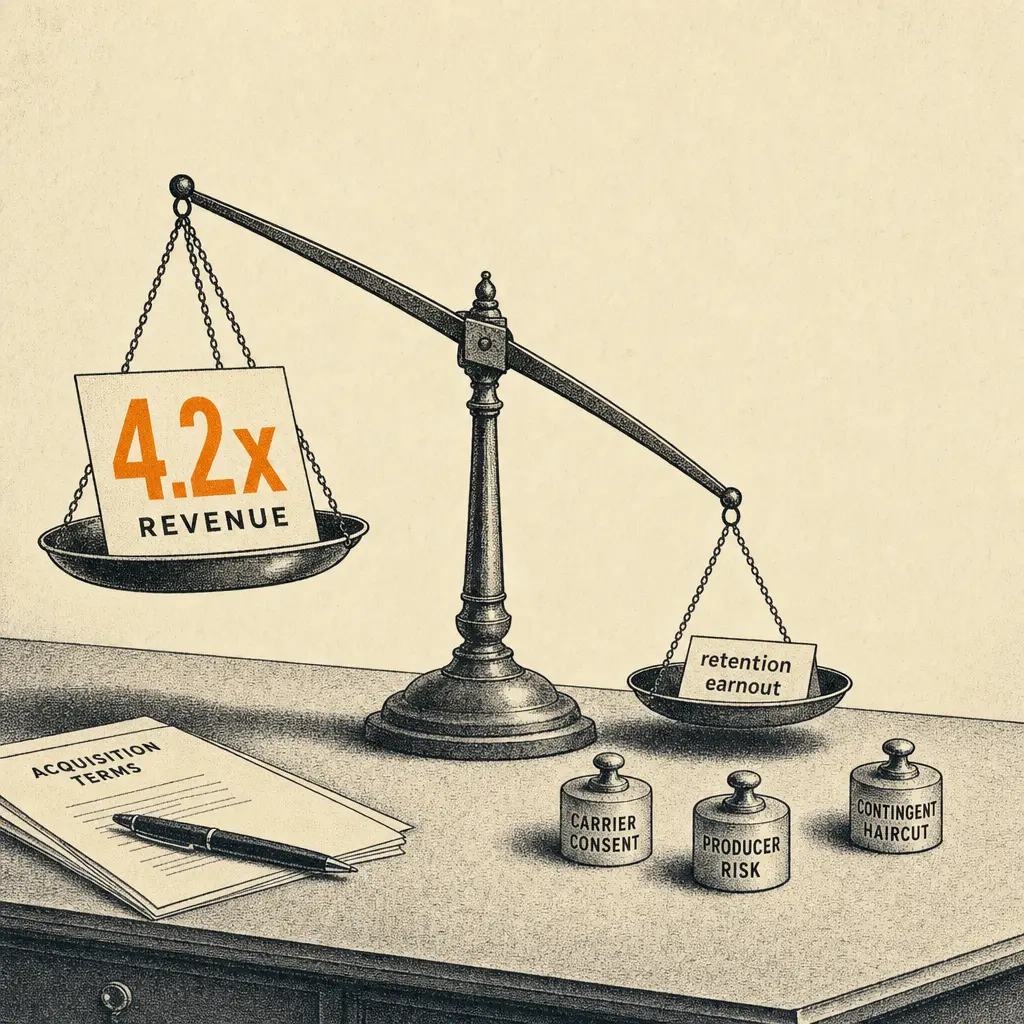
- Deal structure (earnouts, holdbacks, rollover equity) can turn a headline 8x multiple into something closer to 5x in present-value terms. The calculator tells you the headline. The LOI tells you the truth.
- Most agency owners who run a valuation calculator and stop there leave millions on the table because they do not understand which inputs move the number and which buyers pay which multiple.
How does an insurance agency valuation calculator work?
A valuation calculator works by taking your revenue or EBITDA and multiplying it by a market-derived multiple. The math is simple. The multiple is not.
More than 90% of insurance agency M&A deals use some form of EBITDA multiple, per Sica Fletcher's sell-side dataset. The "EBITDA x8" rule of thumb: take net income, add back interest, taxes, depreciation, and amortization, then multiply by 8. A $2M revenue agency with $700,000 in EBITDA lands at roughly $5.6M.
The average multiple in 2025 ran closer to 11.8x for agencies with $1M+ in EBITDA, per Adastra Equity. Current valuations sit roughly 19% above the 10-year index, with the biggest premiums going to agencies with predictable, profitable organic growth, per MarshBerry. Buyers pay for the quality of the earnings stream, not just its size.
What is my insurance agency worth?
Buyers use three approaches. Most serious acquirers run more than one and cross-check, per QuoteSweep's 2026 guide.
Revenue multiples. Multiply annual commission revenue by a factor. Personal lines agencies under $1M revenue trade at 1.5x to 2.0x. Commercial-focused agencies at $1M to $5M get 1.8x to 2.5x. Diversified agencies above $5M command 2.2x to 3.5x, per CT Acquisitions. The limitation: revenue multiples ignore profitability. Two agencies at $2M in commissions can have wildly different bottom lines.
EBITDA multiples. Standard for agencies above $1M in revenue. Buyers use adjusted EBITDA, normalizing owner comp to market and removing one-time expenses. Mid-size agencies trade at 6x to 8x EBITDA. Larger agencies at $5M to $10M reach 8x to 10x. Regional platforms above $10M command 10x to 12x or higher, per IA Valuations. An owner drawing $400,000 when a replacement GM costs $200,000 gets $200,000 added back, per Renegade Insurance.
Book of business valuation. For partial book sales, the book is valued directly at 1.0x to 2.0x annual commissions. The multiple depends on retention, line mix, account concentration, and producer dependency, per QuoteSweep. Commercial books with 92% retention reach 2.0x to 2.5x. Personal lines below 85% retention might not clear 1.2x.
What factors move the multiple the most?
Four levers determine where your agency lands inside the 6x to 14x band, according to Adastra Equity's insurance agency valuation model.
1. Book retention. The single biggest driver. Retention above 90% earns premium pricing. Below 80% triggers heavy earnouts and compresses the multiple by 2 to 3 turns, per Adastra. A $3M revenue agency at 92% retention can be worth 1x to 2x more EBITDA than the same agency at 78%. Top agencies maintain 93% to 95% retention while the industry average sits at 84% to 85%, per QuoteSweep.
2. Carrier appointments and commission mix. Agencies with premier carrier appointments (Travelers, Chubb, Hartford, Liberty Mutual) command higher multiples than those dependent on substandard markets, per CT Acquisitions. Commercial lines books trade at 7x to 10x EBITDA. Personal lines at 5x to 7x. Specialty and employee benefits reach 9x to 12x. Moving from 70% personal lines to 60% commercial can add 3 to 4 turns without growing EBITDA, per Adastra.
3. Organic growth rate. With rate increases moderating to near zero, organic growth is the cleanest buyer signal, per Adastra. Agencies with 15%+ organic CAGR (excluding rate-driven growth) earn platform-tier pricing. Agencies averaged 11% revenue growth over the past two years driven largely by rate, per IA Valuations. That tailwind is fading.
4. Deal structure. Earnouts tied to book retention over 12 to 24 months are standard when retention is below 85% or producer concentration is high, per Adastra. Rollover equity is common at the $1M to $3M EBITDA tier. A stated 8x multiple with a 25% earnout over 24 months is functionally a different number than 8x all-cash at close.
Why is a calculator alone not enough?
Valuation calculators produce a range. What they cannot do is tell you which buyer type will pay the top of your range and which will anchor to the bottom.
MarshBerry highlights that the middle market ($500K to $10M revenue agencies) faces the most consolidation pressure. PE-backed consolidators drove over 80% of broker M&A in 2024 and H1 2025, per Adastra. These buyers want commercial-heavy books, 90%+ retention, diversified carrier panels. If your agency fits, you compete in their auction. If not, you compete for regional strategic buyers who pay different multiples.
Consolidation is no longer a trend. It is a structural feature of the independent agency system, per IA Valuations. The gap between premium multiples and average multiples keeps widening.
What can a valuation calculator miss?
Three things a spreadsheet misses:
First, carrier consent risk. If your top-three appointments represent 60% of revenue and those carriers have change-of-control approval rights, the buyer's multiple discounts for the risk one appointment does not transfer.
Second, producer dependency. If one producer owns 40% of the book with a weak non-compete, the buyer treats that revenue as at-risk. The calculator treats it the same as any other dollar.
Third, contingent commission normalization. Buyers discount contingent income because it is volatile. Adastra notes that agencies with contingent income above 15% of revenue face terminal-value haircuts. If your EBITDA includes $150,000 in contingency commissions and the buyer normalizes to $75,000, your implied valuation drops.
What would we actually do?
I have watched agency owners run a valuation calculator, see a number, and anchor to it like it was carved in stone. It is not. The calculator is a mirror, not a map. It reflects the inputs you give it. If your retention data is sloppy, your adjusted EBITDA is inflated with personal expenses you cannot document, or your mix is 80% personal lines in a market where buyers are paying for commercial, the number you see is not the number you will get.
CT Acquisitions puts it directly: the dispersion between a platform-quality book and an average book inside the same revenue band can be 1.5x revenue. That is not a rounding error. That is the difference between a retirement funded and a retirement deferred.
If you are running the calculator because you are three years from an exit, use it to identify the gap between where you are and where the premium multiples live. Retention below 90%, fix it. Too much personal lines, start building commercial. One producer carrying the book, diversify or tighten the non-compete. The calculator tells you what you are worth today. The work between today and the LOI tells you what you will actually get.
Frequently Asked Questions
What multiple do insurance agencies sell for in 2026?
Insurance agencies sell for 1.5x to 3.5x annual commission revenue, or 6x to 12x adjusted EBITDA in 2026, per CT Acquisitions and Sica Fletcher. Personal lines agencies trade at the lower end. Commercial and specialty agencies with strong retention command the higher end. Agencies with $1M+ EBITDA averaged 11.8x in H1 2025, per Adastra Equity.
Is EBITDA or revenue a better way to value an insurance agency?
EBITDA is the standard for agencies above $1M in revenue because it accounts for profitability differences that revenue multiples ignore, per Sica Fletcher. Revenue multiples remain common for smaller agencies and book-of-business transactions. Most serious buyers run both and triangulate.
What is the biggest factor that determines my agency's value?
Book retention rate is the single largest value driver, per Adastra Equity and QuoteSweep. Retention above 90% earns premium multiples and higher cash-at-close. Retention below 80% triggers heavy earnout structures and compresses the multiple by 2 to 3 turns. Top agencies maintain 93% to 95% retention while the industry averages 84% to 85%.
Can I sell just my book of business instead of the whole agency?
Yes, partial book sales are common when a producer departs or when a seller wants to retain the agency entity. Book sales typically trade at 1.0x to 2.0x annual commissions, with the multiple driven by retention, line mix, account concentration, and producer dependency, per QuoteSweep. Commercial lines books with diversified accounts reach 2.0x to 2.5x.
Why do earnouts reduce my actual sale price?
Earnouts defer a portion of the purchase price contingent on post-close book performance. A stated 8x multiple with a 25% earnout over 24 months is functionally worth less than 8x in cash at close. Earnouts are standard when retention is below 85% or producer concentration is high, per Adastra Equity. The headline multiple and the net present value are different numbers.
Sources
- Sica Fletcher - EBITDA x8: A Quick Insurance Agency Valuation Rule of Thumb
- MarshBerry - Navigating the Future: Key Trends in Insurance Brokerage M&A
- CT Acquisitions - Insurance Agency Valuation (2026): Book Multiples & Buyers
- Adastra Equity - Insurance Agency Valuation & EBITDA Multiples (2026)
- QuoteSweep - How to Value an Insurance Agency in 2026
- Renegade Insurance - Understanding EBITDA in Insurance Agency Valuation
- IA Valuations - Four Insurance Agency Valuation Trends to Watch in 2026