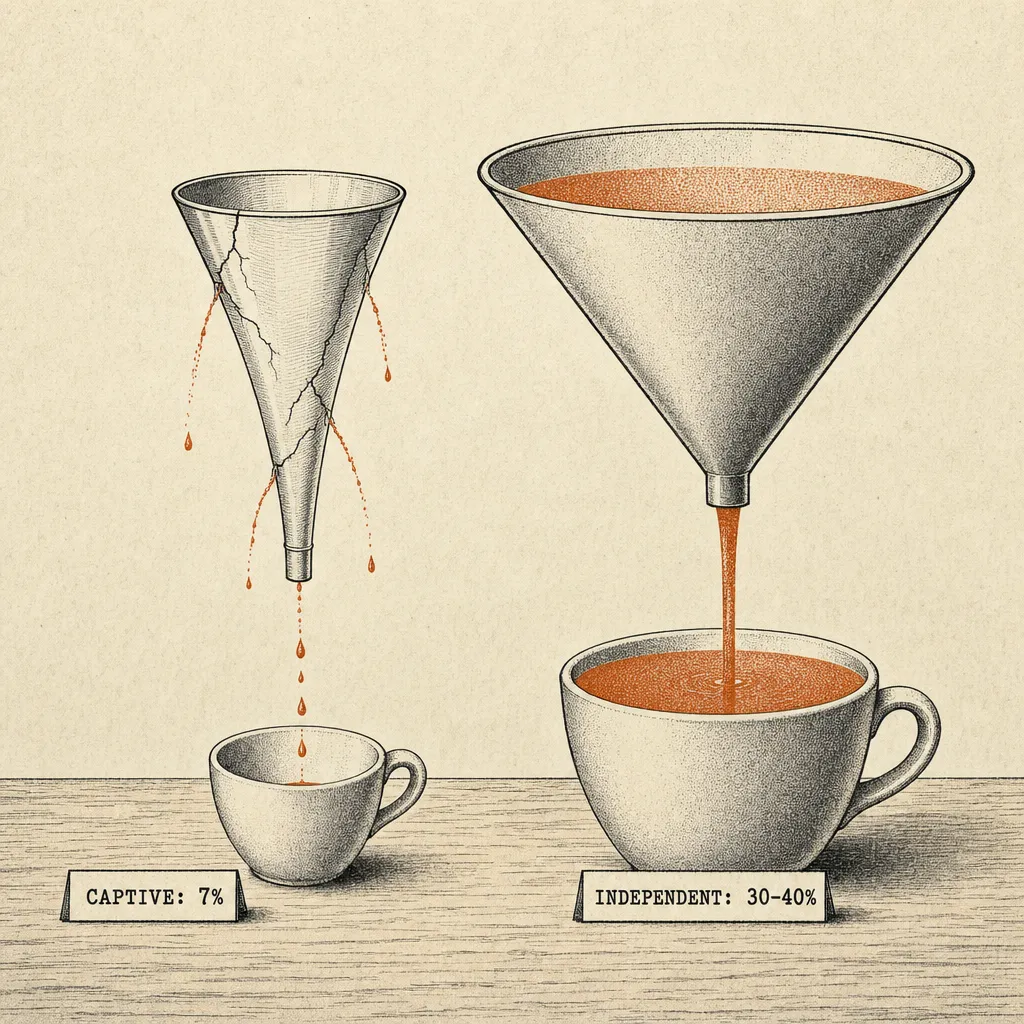
Captive Vs Independent Close Ratios
Captive agents close 7 percent of quotes; independents close 30 to 40 percent. The five-hour test, revenue-per-hour math, and what the gap costs over a career.
There's a number that captive insurance agents don't like to talk about. Not because it's embarrassing, because it's devastating once you actually think about it.
Your close ratio.
If you're a captive agent, you're probably closing somewhere between 7 and 10 percent of the quotes you generate. And I'm being generous with that range. One veteran agent who spent over a decade at a major carrier admitted his auto close ratio never broke 10 percent, and said anyone familiar with the real data would laugh at even that figure.
While no single industry-wide study publishes captive vs. independent close ratios, these figures are consistently reported across independent agency networks like SIAA and Smart Choice, and corroborated by agents who have made the transition, with the differential attributed to single-carrier pricing constraints versus multi-carrier market access.
Let's do the math that your carrier will never put in front of you.
What Does the Five-Hour Test Reveal About Captive Close Ratios?
Imagine you spend five hours quoting twenty households. That's a reasonable afternoon of work, phone calls, comparisons, follow-ups, emails. Twenty real prospects who walked in, called, or clicked, and are actively looking to spend money on insurance with you.
As a captive agent at a 7 percent close ratio, you write roughly one and a half policies. Let's be generous and say you average $200 in gross commission per household. That five hours just generated about $280 in revenue.
As an independent agent with fifteen carriers and a 35 percent close ratio, those same twenty households produce seven policies. That's $1,400 from the same five hours of work.
Same prospects. Same effort. Same market. Five times the revenue.
Now extend that across a month. A quarter. A year. A career. The compounding difference between 7 percent and 35 percent isn't just a better paycheck, it's the difference between building a real business and running on a treadmill.
Why Are Captive and Independent Close Ratios So Different?
This isn't about skill. The best captive agents in the country still can't close what an average independent agent closes, because the constraint isn't talent, it's product.
When a prospect walks in and your carrier's rate is $2,400 for auto insurance, but three other carriers would offer $1,700 for the same coverage, you lose that quote. Period. No amount of salesmanship or relationship-building changes the math when your only option is 40 percent more expensive than the competition.
Independent agents solve this by having options. If Carrier A is expensive for young drivers, Carrier B might be the best option. If Carrier C doesn't write homes in a certain zip code, Carrier D probably does. The independent agent's job isn't to sell one product, it's to match the right carrier to the right risk.
That matching is why close ratios triple or quadruple. You're not getting better at selling. You're getting better options to sell.
What Is the Hidden Cost of Client Trust Erosion in Captive Distribution?
Here's what the close ratio conversation usually misses: every prospect you turn away as a captive agent is a failed relationship before it started.
When someone calls your office and you can't help them, because your rates are too high for their profile, or your carrier doesn't have an appetite for their particular risk, that person walks away thinking you personally couldn't help them. They don't distinguish between "the agent" and "the carrier." They just know they didn't get helped.
Now multiply that by the 90 percent of people you're turning away. That's ninety humans per hundred who had a bad experience with your office. Some of them talk. Some of them are neighbors or family members of your existing clients. The reputational cost of a single-carrier model compounds in ways that are impossible to measure but very real.
An independent agent who spent time as a captive described it this way: failing to meet the needs of over 90 percent of people willing to spend their insurance dollars with you is simply a bad business model. It's not a reflection of your effort. It's the architecture of the system you're operating in.
What Is the Real Revenue-Per-Hour Reality of Captive vs Independent?
Let's get more specific. If you're spending a hundred hours a month on quoting and sales activities and your close ratio is 8 percent, you're writing roughly eight policies per hundred quotes. At $200 average commission, that's $1,600 from a hundred hours of selling work. That's $16 per selling hour, before you pay for staff, rent, marketing, or the coffee that keeps you going.
At a 35 percent close ratio with the same effort, you're writing thirty-five policies. That's $7,000 from a hundred hours. Seventy dollars per selling hour.
Now factor in that your office costs are roughly the same either way. Rent doesn't change. Staff costs don't change much. Your marketing spend might actually decrease as an independent because you're converting more of the leads you already generate.
The gap isn't marginal. It's structural.
Does a Higher Captive Commission Rate Actually Compensate for the Volume Gap?
This is the counterargument I hear most often. And it's partially true, some captive carriers offer higher base commission rates than what you'd get through a network or aggregator as a new independent.
But commission rate multiplied by close ratio is what matters. A 12 percent commission on eight policies per month is less than a 10 percent commission on thirty-five policies. The rate means nothing if you can't close.
The agents who've made the switch consistently report that their total compensation increases even when their per-policy commission decreases, because volume makes up the difference many times over.
How Does the Close-Ratio Gap Compound Across a Captive Career?
A captive agent writing 100 policies per year builds a book slowly. An independent agent writing 400 policies per year in the same market with the same effort builds a book four times faster.
After ten years, the independent agent's book is dramatically larger. The retention is often better because clients were properly placed with the right carrier the first time. And when it comes time to sell, that book is valued at EBITDA multiples of 6 to 10 times, while the captive agent's smaller book is valued at a revenue multiple of 1.5 to 2.5 times. The valuation gap between captive books and independent agencies compounds on top of the close ratio gap. (Independent agency valuation ranges are corroborated by Peak Business Valuation and Sica Fletcher, which both cite EBITDA multiples of 6 to 10x for well-run independent agencies.)
The close ratio gap doesn't just affect your monthly income. It affects the enterprise value of the asset you're building. It affects how fast you get there. And it affects how much freedom you have along the way.
What Question Should You Have Asked in the Captive Interview?
"The agencies that command top-of-market multiples aren't just growing revenue, they're improving the operational fundamentals that buyers actually underwrite: retention, margin, and management depth." Phil Trem, President of Financial Advisory, MarshBerry (source)
When you first signed on as a captive agent, nobody showed you this math. They showed you the commission structure, the branding support, the training program, and the potential income at the top of the leaderboard.
They didn't show you the close ratio. Because if they did, the math would tell the story before the recruiter could.
Seven percent. That's not a sales problem. That's a structural characteristic of the single-carrier model, a factor agents weigh when evaluating their long-term business model. Any decision about changing models involves contract, legal, and financial considerations that go well beyond close ratios alone. If you're weighing that decision, our ten-year captive-to-independent roadmap covers the realistic timeline.
Frequently Asked Questions
Q: What close ratio can I expect as an independent?
A: Multi-carrier independents commonly report 30 to 40 percent on auto, though the exact number depends on your carrier lineup, state, and underwriting appetite. Agents transitioning from captive typically need 6-12 months to see the full ratio lift as they learn each market's appetite.
Q: How do National General commissions compare to captive Allstate?
A: As a sub-agent through a network like SIAA, commissions vary by carrier and often include profit-sharing, which captive structures don't. Agents posting transition numbers in forums generally report higher effective earnings per bound policy because close ratios rise sharply with multi-carrier access, volume dominates rate.
Q: Will I make more as an independent?
A: Most agents report higher total income within 18-24 months of going independent, primarily because close ratios rise 3-4x. The first 6-12 months usually includes an income dip during the carrier-appointment and AMS buildout, see how to go independent after ten years captive for the ramp math.
Q: Should I join SIAA or Smart Choice before I launch?
A: Most new independents start with an aggregator (SIAA, Smart Choice, PGI, Keystone) to solve the carrier-appointment chicken-and-egg problem, then move to direct appointments as premium volume grows. That path shortens the close-ratio ramp meaningfully compared to chasing 20 direct appointments before launching.
Sources & References
- MarshBerry: Agency Valuation Framework: https://www.marshberry.com/resource/how-to-think-about-value/
- Peak Business Valuation: Insurance Agency Multiples: https://peakbusinessvaluation.com/valuation-multiples-for-an-insurance-agency/
- Sica Fletcher: Insurance Agency Valuation Rule of Thumb: https://www.sicafletcher.com/post/insurance-agency-valuation-rule-of-thumb-scf
- SIAA (Strategic Insurance Agency Alliance): https://www.siaa.com
- Smart Choice Agents: https://www.smartchoiceagents.com